Overview
This window is displayed by selecting Report Settings from the Edit menu on the Assignments Editor window.
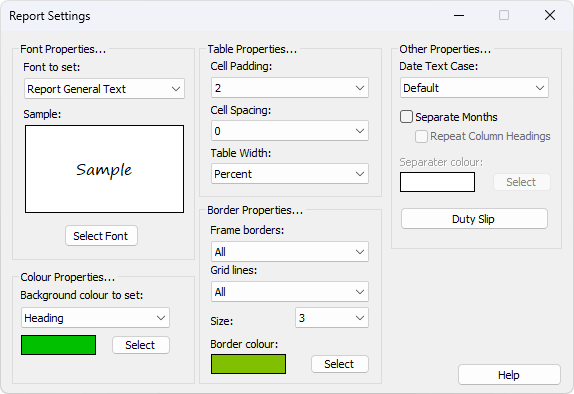
The Report Settings window offers a variety of options to allow you to customize how reports are printed. This gives you more control over how the reports are created. The window is in four main sections, each of which is described in detail below.
You can still use the Assignments Editor whilst the Report Settings window is visible. And the schedule is automatically updated as you make changes to the settings (when the Preview Tab is active).
 Learn more about the Report Settings window by looking through the rest of this help topic. Or, as an alternative, click on the item you are interested in on the screenshot above.
Colour Properties
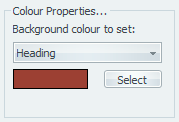
There are several background colour settings that can be changed:
- Heading
- Date
- Even Row
- Odd Row
- Highlight
- Special Event
- Notes
- Empty Cells
Simply select the colour property you want to change and then click the Select button to display a colour dialogue from which you can select a different colour.
Font Properties
There are five font settings that can be changed. Use the dropdown list to select which font you would like to change. Then select a different font or modify the current font style and colour properties.

Available fonts are:
- Report Column Headings
- Report General Text
- Report Title
- Report Special Event
- Report Notes
Table Properties
There are three settings that affect how the table is displayed.
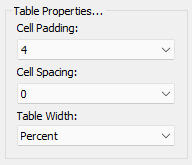
- Cell Padding
refers to the gap between each cell in the table. - Cell Spacing
refers to the gap between the text in the cell and the edge of the cell (think of cell spacing as a kind of margin area around the text). This will also apply to the grid lines. So you can create a kind of double-line style effect. - Table Width
can be set to one of two options. Literal lets the system decide how wide each column width should be. Literal will generally avoid word-wrapping if it can. Percent will cause the table to be 100% wide and all the columns would be proportionally adjusted to fill this space.

Border Properties
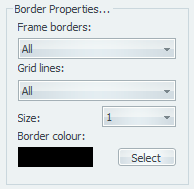
- Frame borders
refers to the outside grid lines. There are 8 settings you can choose from: - None
- Horizontal
- Vertical
- All
- Top
- Bottom
- Left
- Right
- Grid lines
refers to the remaining grid lines that are between each row and each column. There are four settings you can choose from: - None
- Horizontal
- Vertical
- All
- Size
refers to the thickness of the border. If you set this value to 0 then no frame or grid lines will be visible in the exported document. - Border colour
is the colour of the grid lines. Click the Select button to display a colour dialogue from which you can select a different colour.
Other Properties

Date Text Case
You can change the way the dates are displayed on the reports. There are four choices to choose from:
- Default
Dates are displayed using the operating systems default settings. - Title Case
Dates are displayed with the first letter of each word is capitalized. - lowercase
Dates are displayed in lowercase. - UPPERCASE
Dates are displayed in uppercase.
Separate Months
This causes the schedule to include a small gap between each calendar month. Options are provided for you to specify the colour of this gap.

You can specify the colour for the separator by clicking the Select button.
Repeat Column Headings
This will cause the column headings to be repeated at the start of each month.
Duty Slip
Press this button to display the Duty Slip Settings window. Here you can adjust the labels used on the slips. Make sure you select the correct style template too!